Want to see red?
Leverage your SitaWare suite to fuse intelligence and share awareness of your opponent’s deployments and capabilities.
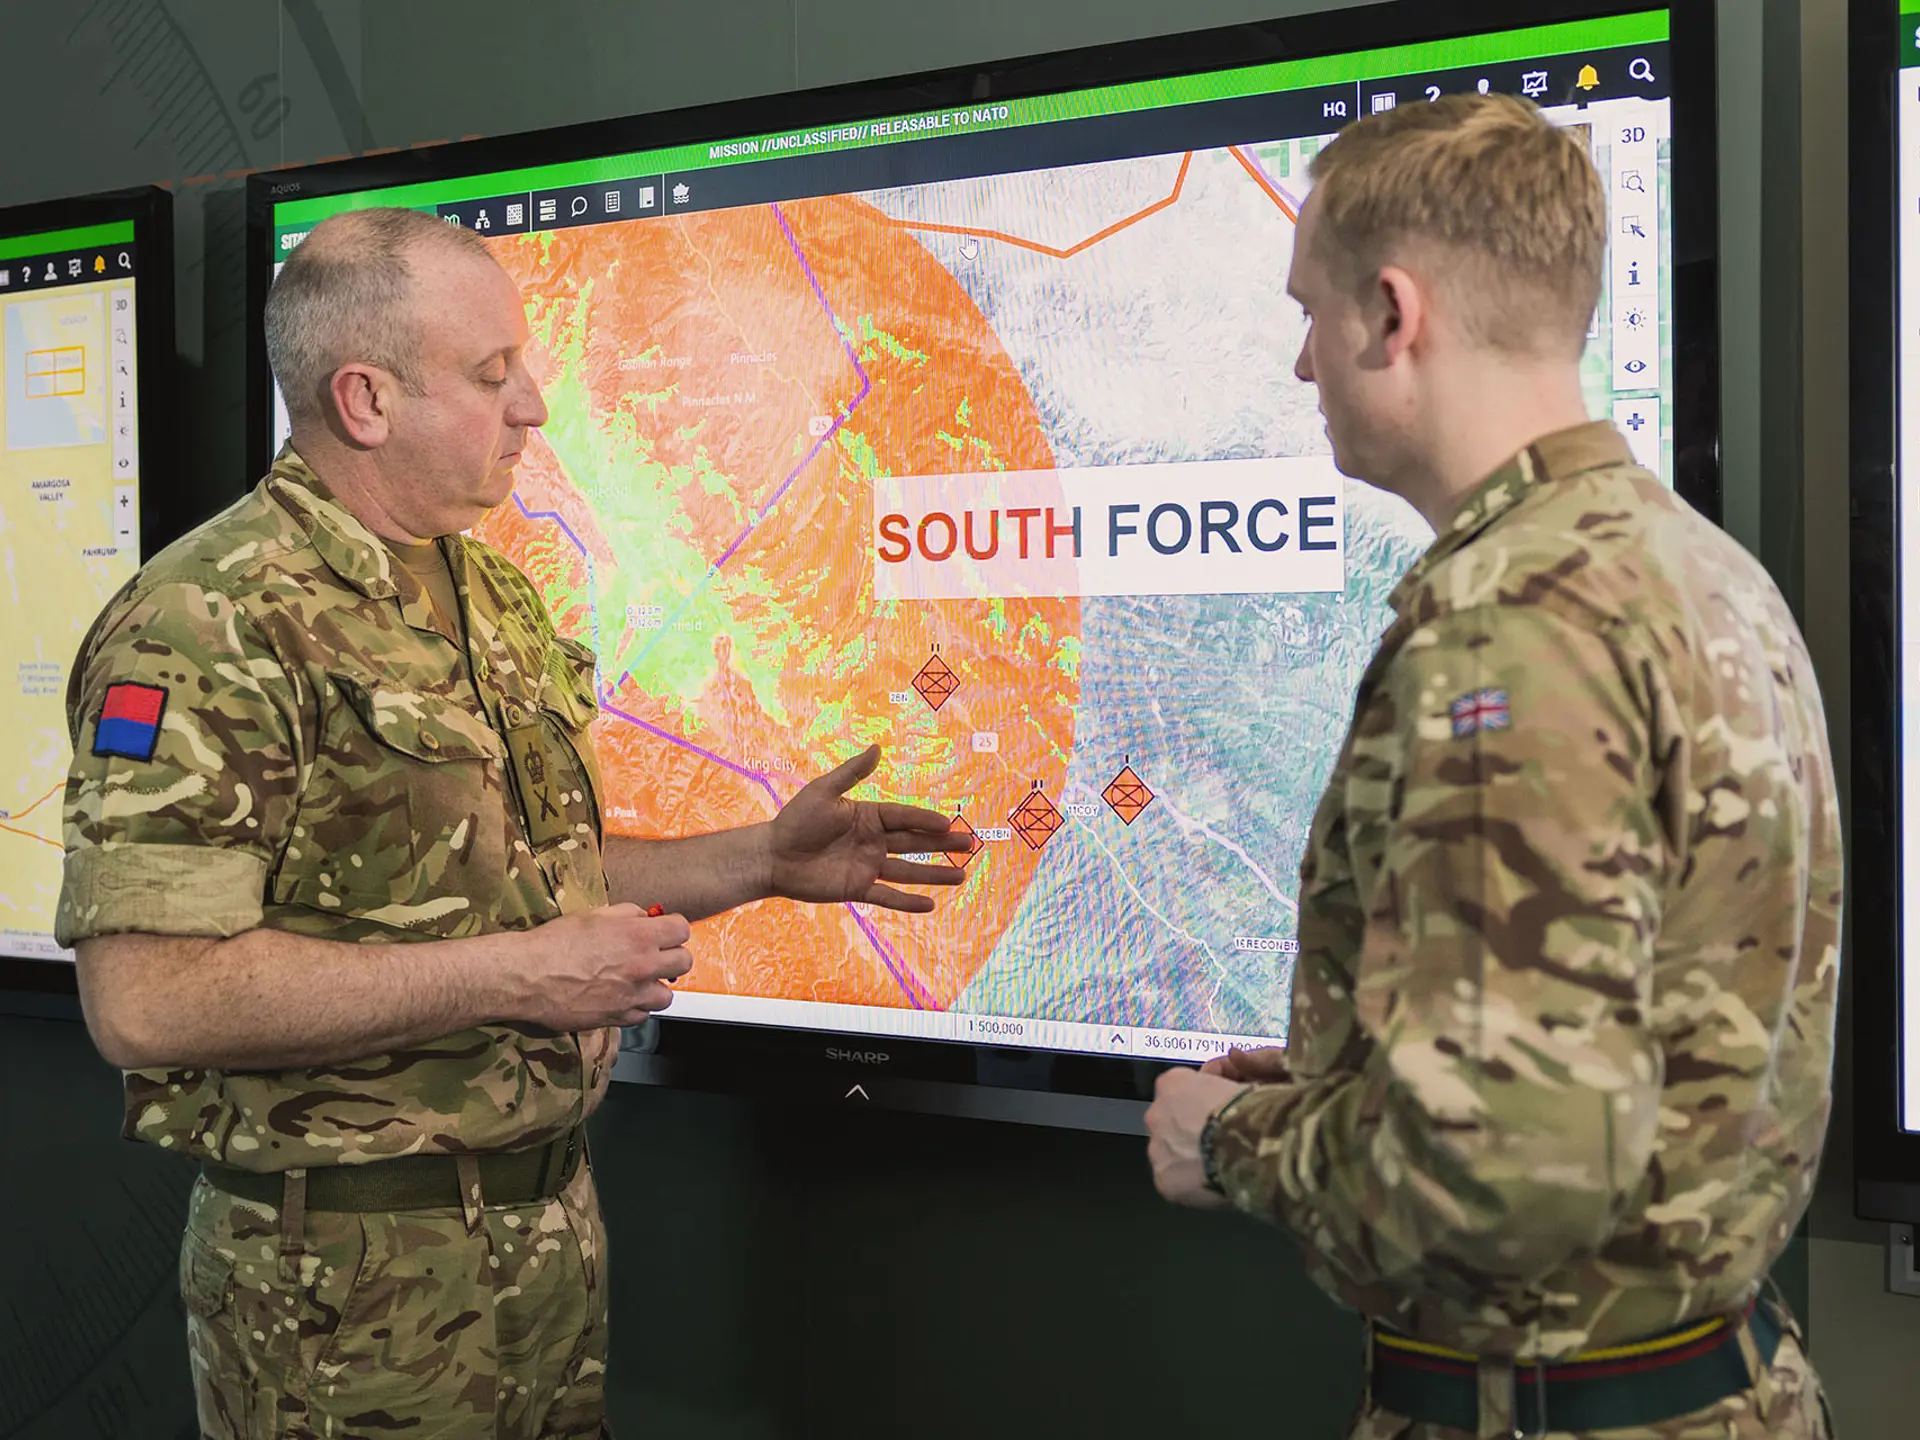
SitaWare has combat-proven capabilities in blue force tracking capabilities, helping militaries around the world plan, co-ordinate, and execute military operations – allowing for superior situational awareness of friendly forces, and what they intend to do. However, knowing where the enemy is on the battlefield, and what kind of unit they are, is just as important to commanders at all levels. The SitaWare suite can deliver this data organically as part of its existing functionality, creating a holistic battlespace view for a military commander.
What is a red picture?
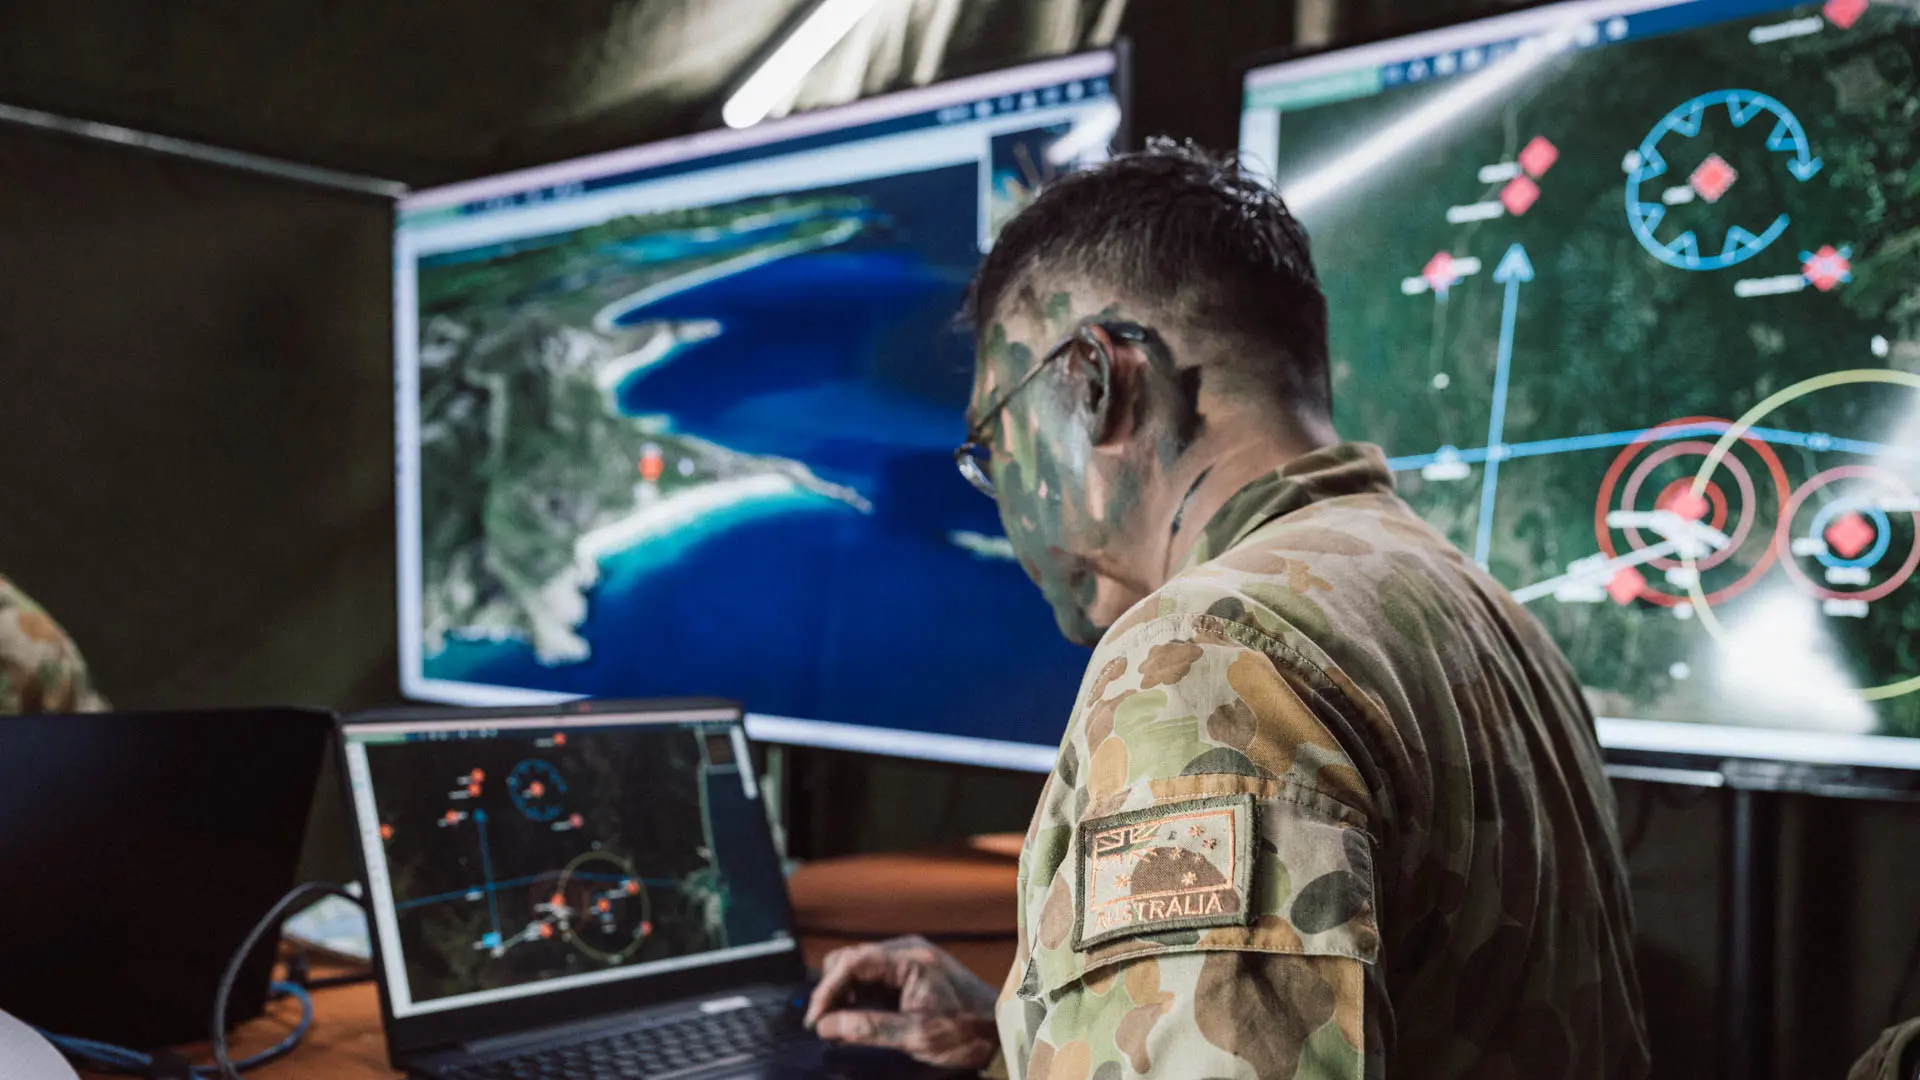
Within the command environment, a red picture is a combined image showing the location and type of enemy forces on the battlefield. This is compiled through a variety of means – battlefield intelligence, sensor feeds, open-source intelligence data, and more. The SitaWare suite is able to generate a red picture through the use of view selection and layer exports – no extra software or support necessary.
The location of enemy forces can be added into the SitaWare suite through a variety of – automated data ingestion through sensor feeds, manual addition by troops reporting positions on the ground, analysts examining video and sensor feeds, or through track management systems such as ADS-B and AIS. Using NATO standard symbology, meaning is added to the red picture, showing where an opponent is deploying their units, their movements, and capabilities.

With the continuous synchronisation of data allowing near real-time visualisation, the SitaWare suite tracks and monitors both friendly forces as well as the movements of enemy units. Data delivery through the software stack from fixed headquarters to dismounted soldiers means that the Common Intelligence Picture (CIP) is regularly updated with ease.
Bringing together the information from a red picture can allow for the analysis of the organisation and dispersal of units according to doctrine – helping to understand an opponent’s intent. Additionally, enriching an enemy symbol with data on its parent unit, capabilities, and position can help commanders plan and equip their forces accordingly.
Multiple sources, one single vision
Information management within the command environment has been one of the core benefits of the deployment of SitaWare into militaries undergoing a digitalisation process. Moving away from paper maps and into digital displays means that greater data fidelity can be delivered to users across the battlespace. Creating map layers means that the data that is most relevant to a particular audience is displayed and distributed. Multiple methods of communicating – from chat windows to file transfers – means that requests for support or the distribution of plans and orders is automated, streamlined and made more efficient.
Creating and visualising the red picture comes as part of a fusion capability, formed out of the software’s layer generation and synchronisation capabilities, that has been at the core of SitaWare’s situational awareness principles since it was first deployed.
Ingestion of a variety of data source formats, including ADS-B, APP-11, OTH-GOLD, and MISB, mean that detection, tracking, and reporting objects within an area of operations is assured. Additional information feeds – such as equipment libraries and capability data – help to enrich the intelligence picture for users in the battlespace. Users can add further data on enemy forces, such as video clips and snapshots, field photographs, and electronic intercept data, to add further depth to a red picture and support commanders’ decision-making capabilities.
Entity processing with correlation and fusion
Once you know where the enemy is, tracking them is the next step, with the generation of red-force tracks helping to understand an opponent’s intent and methods of operations. Is the movement of an EW unit a screening effort for a larger force, or a feint? How is their disposition reflective of doctrine, and how will this impact their next move?
For land users at the battalion level and above, SitaWare Headquarters utilises an AI-powered correlation and fusion engine to de-duplicate objects detected and reported to ensure the correct CIP is communicated through the battlespace.
SitaWare Maritime users can perform this correlation and fusion work at the ship level, before it is transmitted upwards to a task group or maritime command centre/maritime operations centre (MCC/MOC). Inputs from multiple assets and additional sensors in the area of operations are then correlated into a national recognised maritime picture (RMP), for continued monitoring at the national level or for communication to a multinational coalition command. A RMP and red picture that is filtered according to an area of interest can also be distributed downwards to deployed vessels, ensuring that data is limited to the necessary data for the right users.
Liked this? Check out part 2 of the Want to see red? blog, covering data distribution, scaling, and data lakes.


